
You’re looking at a series of quick in-house-made e-commerce analyses that we post weekly on our LinkedIn page.
The results come from our data that are collected at every e-point of sale and analyzed by our consultants.
Every week, we pick a different retailer in a different country, focusing on a specific online category to offer you a detailed outlook on the FMCG omnichannel.
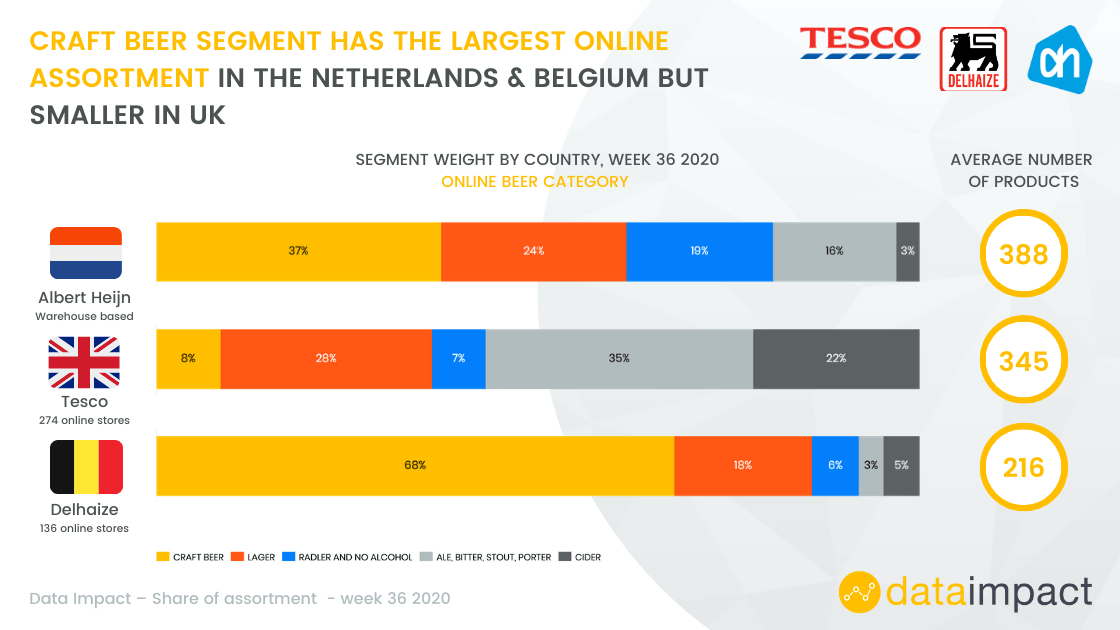
This week, we’re zooming in on the online beer category across countries. The craft beer segment has the largest online assortment in the Netherlands & Belgium. In the UK, different segments seem to be stronger.

DataImpact undertakes to ensure that the collection and processing of your data, carried out from the www.dataimpact.io site, comply with the Data Protection Act and the RGPD. This processing is necessary for the execution of our services and the internal functioning of our company. For any information on the protection of personal data, you can also consult the site of the Commission Informatique et Liberté www.cnil.fr.
Personal data are collected by : Société par actions simplifiée DataImpact whose registered office is at 39 Rue Lucien Sampaix, 75010 Paris, RCS PARIS 799 367 222 T: +33 (0)1 42 51 87 08
DataImpact is likely to collect personal data about you for the purposes necessary for its activity, whether in terms of recruitment, responding to your requests for information, execution and monitoring of service contracts. Types of data collected: DataImpact only collects data that is strictly necessary for the purposes of its activity. The personal data collected can be the following:
-In the context of a request for information (name, first name, email, telephone, company name).
-As part of a recruitment process: (surname, first name, email, telephone, company name), information on the curriculum vitae (marital status, surname, first name, date and place of birth, nationality, professional background, academic background, hobbies)
-If necessary, connection data including your IP address may be collected for purely statistical purposes.
The personal data collected by DataImpact are those directly given by the person concerned when using the contact form or surfing on the site www.dataimpact.io.
To date, DataImpact does not transfer, nor envisage any transfer of your personal data to a non-European Union member state.
Connection data are kept at the latest within one year after connection to the www.dataimpact.io website.
Data relating to applicants for a post are kept at the latest five years after the last contact, with a view to possible recruitment.
Data of prospects are kept no later than three years after the last contact.
Customer data are kept for the duration of the service contract.
DataImpact ensures that its employees and service providers, subcontractors or hosts, also respect the absolute confidentiality of the information provided to them.
We maintain in-house electronic and organizational security measures in relation to the collection, storage, and communication of data.
DataImpact takes all appropriate measures in order to facilitate the exercise of the rights of its clients regarding their personal data (right of access, rectification, deletion, limitation of processing, portability, to define the fate of its data after death).
The information provided in connection with the exercise of these rights is provided in writing or electronically. On request, the information may be provided orally. All requests should be sent by post to 739 Rue Lucien Sampaix, 75010 Paris or to [email protected].
In accordance with the regulations in force, your request must be signed and accompanied by a photocopy of an identity document bearing your signature and specify the address to which the reply should be sent. A reply will then be sent to you as soon as possible and in any event within one month of receipt of the request.
The new article 40-1 of the French Data Protection Act allows individuals to give instructions regarding the storage, deletion and communication of their data after their death.
You can read the procedure relating to these directives by following the following link: “https://www.cnil.fr/fr/ce-que-change-la-loi-pour-une-republique-numerique-pour-la-protection-des-donneespersonnelles#mortnumerique”.
You are informed that, during your visits to the www.dataimpact.io website, a cookie may, if necessary, be automatically installed on your browser software. A cookie is a small file stored on your computer. As such, it is a block of data that does not allow users to be identified but is used to record information relating to their browsing on the site. Cookies are used, on the one hand, to facilitate your navigation on the site and, on the other hand, for statistical purposes. In order to better know the frequentation of the site, we (mainly) measure the number of pages viewed, visitors, visits, as well as the activity of visitors on our site and their frequency of return.
The parameters of the browser software make it possible to inform about the presence of cookies and possibly to refuse them in the manner described at the following address “http://www.cnil.fr/vos-libertes/vos-traces/les-cookies/”.
You have the right to access, withdraw and modify personal data communicated through cookies under the conditions indicated above.
Article 6 III of the Law of 22 June 2004
Société par action simplifiée DataImpact
39 Rue Lucien Sampaix, 75010 Paris
T: +33 (0)1 42 51 87 08
M: [email protected]
RCS PARIS 799 367 222
Director of publication: Yacine TERKI
Hosting : O2 SWITCH 222 Boulevard Gustave Flaubert 63000 Clermont-Ferrand
The information contained and consultable on this site is provided for information purposes by DataImpact. They can be modified at any time without notice. Under no circumstances does it constitute advice or a service of any kind whatsoever. You assume full responsibility for the use of this site or the information it contains.
DataImpact cannot be held responsible for damages related to the consultation or use of the website by the user. Hypertext links may refer to third party sites over which DataImpact has no control.
DataImpact declines all responsibility for the content of these sites. The use of this service is reserved for strictly personal use. Any reproduction or representation, of all or part of the information, brochures or logos contained on the site, on any medium whatsoever, is prohibited. Failure to comply with this prohibition constitutes an infringement that may result in civil and criminal liability of the counterfeiter.

